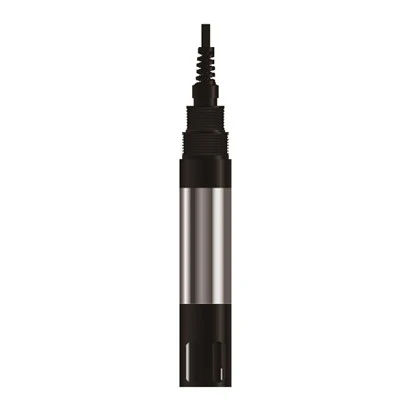
Hey there! I’m a supplier of turbidity sensors, and I’ve been in this game for quite a while. Turbidity sensors are super important in a bunch of industries, from environmental monitoring to water treatment plants. But just having a turbidity sensor isn’t enough. You gotta know how to analyze the data it spits out. So, in this blog, I’m gonna share some tips on how to do just that. Turbidity Sensors
Understanding Turbidity and What the Data Means
First off, let’s quickly go over what turbidity is. Turbidity is a measure of how cloudy or murky a liquid is. It’s caused by things like suspended particles, such as sediment, algae, or other microorganisms. When we use a turbidity sensor, it measures the amount of light that’s scattered or absorbed by these particles in the liquid.
The data we get from a turbidity sensor is usually in units like nephelometric turbidity units (NTU) or formazin turbidity units (FTU). These units give us an idea of how turbid the sample is. For example, really clear water might have a turbidity of less than 1 NTU, while water with a lot of sediment could have a turbidity of several hundred NTU.
Step 1: Collecting the Data
The first step in analyzing turbidity data is, of course, collecting it. Our turbidity sensors are pretty easy to install. You can place them in a water source, like a river, a lake, or a water treatment tank. Once the sensor is in place, it’ll start collecting data at regular intervals.
Most of our sensors can be set to collect data every few minutes, hours, or even days, depending on your needs. Some of them can even send the data wirelessly to a computer or a mobile device. This makes it super convenient to keep track of the turbidity levels in real – time.
Step 2: Cleaning and Preparing the Data
Once you’ve collected the data, it’s time to clean it up. Sometimes, the sensor might pick up some noise or errors. For example, if there’s a sudden movement in the water or a glitch in the sensor, it could cause a spike in the data that doesn’t represent the actual turbidity.
To clean the data, you can start by looking for any outliers. Outliers are data points that are way different from the rest of the data. You can use simple statistical methods to identify them. For instance, you can calculate the mean and standard deviation of the data. Data points that are more than a certain number of standard deviations away from the mean can be considered outliers.
After identifying the outliers, you can decide whether to remove them or adjust them. In some cases, it might be better to just remove them if they’re clearly due to errors. But in other cases, you might want to adjust them based on the surrounding data points.
Step 3: Visualizing the Data
Visualizing the data is a great way to get a quick understanding of what’s going on. You can use graphs and charts to represent the turbidity data over time. A line graph is a common choice for showing how turbidity changes over a period.
On the x – axis, you can put the time (hours, days, weeks), and on the y – axis, you can put the turbidity values (NTU or FTU). By looking at the line graph, you can easily see trends in the data. For example, you might notice that the turbidity increases during rainy seasons or after a certain industrial activity.
You can also use bar graphs to compare turbidity levels at different locations or in different samples. This can be useful if you’re monitoring multiple water sources or if you’re testing different batches of water.
Step 4: Analyzing Trends and Patterns
Once you’ve visualized the data, it’s time to analyze the trends and patterns. Look for any long – term trends in the data. Is the turbidity generally increasing or decreasing over time? If it’s increasing, it could be a sign of a problem, like more sediment entering the water source or a malfunction in a water treatment process.
You can also look for seasonal patterns. In many areas, turbidity levels tend to be higher during the rainy season because of runoff from the land. By understanding these seasonal patterns, you can better plan your water treatment or environmental monitoring activities.
Another thing to look for is any sudden changes in the data. A sudden spike in turbidity could indicate a spill, a break in a pipeline, or some other unexpected event. If you notice a sudden change, it’s important to investigate it right away.
Step 5: Correlating with Other Data
Turbidity doesn’t exist in a vacuum. It can be affected by a bunch of other factors. So, it’s a good idea to correlate the turbidity data with other data sources. For example, you can look at weather data, such as rainfall and temperature. As I mentioned earlier, rainfall can increase turbidity due to runoff.
You can also correlate the turbidity data with water quality data, like pH, dissolved oxygen, and nutrient levels. Changes in these parameters can sometimes be related to changes in turbidity. For instance, an increase in nutrient levels can lead to an algal bloom, which can increase turbidity.
Step 6: Making Predictions and Taking Action
Based on the analysis of the turbidity data, you can make predictions about future turbidity levels. If you’ve identified a long – term trend or a seasonal pattern, you can use this information to estimate what the turbidity will be in the future.
These predictions can be really useful for making decisions. For example, in a water treatment plant, if you predict that the turbidity will increase in the coming days, you can adjust the treatment process in advance to ensure that the water quality remains high.
In environmental monitoring, if you predict that turbidity will increase in a river, you can take steps to prevent further pollution or to protect the aquatic ecosystem.
Why Our Turbidity Sensors Are Great for Data Analysis
Now, I wanna talk a bit about why our turbidity sensors are a great choice for all this data analysis. Our sensors are super accurate. They use the latest technology to measure turbidity, so you can trust the data they collect.
They’re also very reliable. They’re built to withstand harsh environments, whether it’s a dirty river or a chemical – filled water treatment tank. This means you’ll get consistent data over a long period.
And let’s not forget about the ease of use. Our sensors are easy to install and operate. You don’t need to be a tech genius to get them up and running. Plus, they come with software that makes it easy to collect, clean, visualize, and analyze the data.
Wrapping Up and Invitation to Connect

So, there you have it! That’s how you can analyze the data from turbidity sensors. It might seem like a lot of work, but once you get the hang of it, it’s really not that difficult. And with the right tools, like our turbidity sensors, you can make the whole process a lot easier.
Dissolved Oxygen Sensors If you’re in the market for a turbidity sensor or if you have any questions about data analysis, I’d love to hear from you. Whether you’re running a water treatment plant, doing environmental research, or just need to monitor the water quality in your pool, we’ve got a solution for you. Reach out to us to start a conversation about your needs and how we can help you get the most out of your turbidity data.
References
- APHA, AWWA, and WEF. (2017). Standard Methods for the Examination of Water and Wastewater (23rd ed.).
- Hach Company. (2019). Turbidity Measurement Handbook.
- Ryding, S. O., & Rast, W. (Eds.). (1989). Eutrophication: Causes, Consequences, Correctives. Wiley – Interscience.
Shanghai Multiweal Environmental Technology Co., Ltd.
As one of the most professional turbidity sensors manufacturers in China, we’re featured by quality products and low price. Please rest assured to buy discount turbidity sensors in stock here from our factory. Contact us for custom service and OEM&ODM service.
Address: 5-2, Lane 801, Qiangye Road, Sheshan Town, Songjiang District, Shanghai
E-mail: mtw@shmultiweal.com
WebSite: https://www.multiweal.com/
